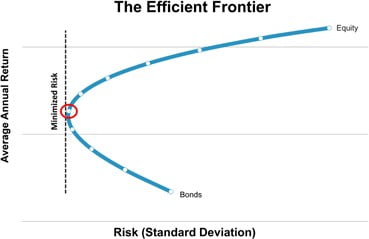
The 60/40 portfolio, consisting of 60% equities and 40% bonds/ fixed income, may be the most common financial recommendation individual investors encounter. It traces its origins to 1952 when economist Harry Markowitz published his Efficient Market investment model that became known as Modern Portfolio Theory.
The brilliance of Markowitz’s theory was the use of diversification to reduce portfolio risk without unduly depressing return. The tools to do so at that time were rather simplistic, individual stocks and bonds. Market history indicated that if equities fell in value, bonds would rise in value. By graphing risk (standard deviation) and mean return basis using market data preceding 1951, Markowitz’s fishhookshaped curve showed that the average highest return for the least amount of risk resulted from a blend of 60% equity and 40% fixed income.

Markowitz developed the Efficient Market Theory before computers and before today’s multitude of investment vehicles were developed that allow investment managers to slice and dice the market into endless allocations. It’s interesting to note that over a 70-year time horizon, that fishhook shape still appears to be valid. But naturally, there’s a catch. Real portfolios don’t have a 70+ year life span to wait out multiple market cycles.
The problem with the Efficient Frontier is that over shorter time periods the “frontier” is a moving target. The 60/40 portfolio was a spectacular failure in 2022 when both equities and bond returns nosedived, resulting in a loss of -16.07% (60% S&P 500 / 40% Barclays Aggregate Bond Index).

The graphic above is from a study published in 2015 in ProActive Advisor Magazine. It depicts the efficient frontier of equity and bond portfolios illustrated in 10% increments. Equity returns are based on the S&P 500® Index, including the reinvestment of dividends. Bond returns include the reinvestment of dividends and are based on the Barclays Capital Aggregate Bond Index. Remember, index returns do not reflect management fees, transaction costs or expenses. The red circle indicates the optimal allocation based on risk/return.
In 1970-1979, the fishhook disappeared as 100% bond and 100% equity portfolios achieve roughly the same return but with equities at more than double the volatility. In 2000-2009, the fishhook inverted, and bonds dramatically outperformed equities, moving optimal risk/return to 30% equities/70% bonds. Only in the 1980-1989 period was 60/40 an optimal allocation.
The moving frontier illustrates the problem with using simplistic 60/40 portfolio designs and expecting a predictable return. Using 70+ years of data fails to match actual results of shorter periods.
In a 2004 interview with Jason Zweig in Money Magazine, legendary investor Peter Bernstein described a rigid allocation like 60% stocks, 40% bonds as a way of passing the buck and avoiding decisions1.
Today’s investment manager has computing power, software tools, data and investment options that far surpass the simplistic financial world Harry Markowitz dealt with in 1952. As Peter Bernstein said in that 2004 interview. “Investors do better where risk management is a conscious part of the process…. I view diversification not only as a survival strategy but as an aggressive strategy, because the next windfall might come from a surprising place. I want to make sure I’m exposed to it.”
Our goal is simple: Manage portfolio risk and optimize return. A rigid allocation limits the ability to strive for that goal across different market environments.
1) Peter Bernstein interview: He may know more about investing than anyone alive by Jason Zweig, MONEY Magazine, October 15, 2004.
